Lucy Chen, Richard G. Frank, Haiden A. Huskamp
Harvard University April 14, 2020
Methods: Using restricted 2013-2014 data from the Medical Expenditure Panel Survey, our sample included 1,190 women ages 18-44 with household incomes below 138 percent of the federal poverty level. For most analyses, we compared women living in expansion states to those in non-expansion states. Outcomes included health insurance coverage and total spending, as well as spending by payer, setting of care, and drug indication.
Key Results:
- Coverage, especially by Medicaid, is likely to decrease if the ACA were overturned. Receipt of treatment as reflected inMedicaid spending will also likely decrease, since Medicaid expansion was associated with an increase in annual per-person Medicaid spending of $771 from 2013 to 2014, compared to non-expansion.
- Overturning the ACA would likely result in reduced use of key prescription drugs for low income women of child-bearing age, as we found that Medicaid expansion was associated with an increase of 2.8 refills per person per year in expansion states from 2013 to 2014, compared to non-expansion states. Among the most commonly used drug classes were central nervous system agents, psychotherapeutic agents, and hormones and hormone modifiers.
Exhibits:
1. Transition Matrix of Changes in Health Insurance Coverage, 2013-2014
2. Spending by Payer for Non-Pregnant, Reproductive-Age, Low-Income Women
3. Spending by Location for Non-Pregnant, Reproductive-Age, Low-Income Women
4. Prescription Drug Utilization for Non-Pregnant, Reproductive-Age, Low-Income Women
Exhibit 1: Transition Matrix of Changes in Health Insurance Coverage from 2013 to 2014
Non-Expansion States
Probability of insurance type in 2014 based on 2013 insurance type
|
2014 |
||||
|
Uninsured |
Medicaid |
Group |
||
|
2013 |
Uninsured |
63.7% |
19.5% |
16.9% |
|
Medicaid |
14.5% |
80.7% |
4.8% |
|
|
Group |
10.7% |
16.5% |
72.8% |
|
Expansion States
Probability of insurance type in 2014 based on 2013 insurance type
|
2014 |
||||
|
Uninsured |
Medicaid |
Group |
||
|
2013 |
Uninsured |
50.0%* |
38.7%*** |
11.2% |
|
Medicaid |
2.9%*** |
94.6%*** |
2.5% |
|
|
Group |
13.1% |
31.1% |
55.8% |
|
Source: Authors’ analysis of data in Medical Expenditure Panel Survey – Household Component Panel 18 of 1,124 women ages 18-44 in with household incomes below 138 percent of the federal poverty level and who primarily reported having no health insurance coverage, Medicaid coverage, or group coverage.
Notes: Analysis used a multinomial logit regression model for 2014 coverage types that included 2013 coverage types, indicator for expansion, coverage*expansion, and covariates, including age, marital status, race/ethnicity, education, health status (fair/poor health vs. excellent/very good/good), and pregnancy status. Insurance coverage was classified into a single category, based on the following hierarchy: Uninsured if uninsured for all 12 months, Medicaid if ever any months on Medicaid during the year, and Group if ever any months on Group coverage during the year. Due to sample size constraints, we were not able to analyze those who reported Marketplace coverage. *P < 0.1 when comparing expansion states to non-expansion states. ***P < 0.01 when comparing expansion states to non-expansion states.
Exhibit 2: Spending by Payer for Non-Pregnant, Reproductive-Age, Low-Income Women
|
Expansion |
Non-Expansion |
|||
|
2013 |
2014 |
2013 |
2014 |
|
|
Any spending in 2013-2014 |
86.7% |
83.5% |
||
|
Total spending |
77.1% |
75.6% |
72.9% |
71.3% |
|
Self |
59.6% |
58.6% |
64.5% |
62.1% |
|
Medicaid |
40.8% |
44.3% |
24.4% |
27.1% |
|
Private |
18.2% |
20.2% |
19.9% |
23.3% |
|
Mean total spending, if any spending in 2013-2014 |
$2,287 |
$3,007 |
||
|
Self |
$271 |
$196 |
$2,823 |
$2,784 |
|
Medicaid |
$1,177 |
$1,894 |
$351 |
$375 |
|
Private |
$443 |
$338 |
$1,470 |
$1,404 |
Source: Authors’ analysis of 1,004 non-pregnant women ages 18-44 with incomes below 138 percent of the federal poverty level using data from the Medical Expenditure Panel Survey – Household Component Panel 18.
Notes: Mean total spending analyses were calculated only including those with any spending during the two years.
Difference-in-Differences Estimates
|
Any Spending (% point) |
Total |
OOP |
Medicaid |
Private |
|
Expansion State |
-0.57 (3.89) P = 0.88 [-8.2, 7.1] |
0.88 (4.81) P = 0.85 [-8.6, 10.4] |
1.28 (3.69) P = 0.73 [-6.0, 8.6] |
-1.2 (4.11) P = 0.76 [-9.3, 6.9] |
|
Amount of Spending ($) |
Total |
OOP |
Medicaid |
Private |
|
Expansion State |
$568 (549) P = 0.30 [-516, 1562] |
-$79 (92) P = 0.39 [-260, 103] |
$771 (383) P = 0.046** [13, 1530] |
-$127 (244) P = 0.61 [-608, 355] |
Source: Authors’ analysis of 1,004 non-pregnant women ages 18-44 with incomes below 138 percent of the federal poverty level using data from the Medical Expenditure Panel Survey – Household Component Panel 18.
Notes: Analysis used a difference-in-differences approach, comparing the change in outcome for women living in expansion states to the change in outcome for women living in non-expansion states. Exhibit lists coefficients, robust standard errors in parentheses, p-values, and 95% confidence intervals in brackets. Covariates included were age, race/ethnicity, education, marital status, and health status. Pregnant women were excluded because they have different overall health care use patterns than non-pregnant women.
Exhibit 3: Spending by Location for Non-Pregnant, Reproductive-Age, Low-Income Women
Any Spending
|
Expansion |
Non-Expansion |
|||
|
2013 |
2014 |
2013 |
2014 |
|
|
Office-based |
61.2% |
64.3% |
56.6% |
59.4% |
|
HOPD |
8.0% |
9.0% |
11.7% |
10.9% |
|
ER |
20.9% |
19.6% |
21.8% |
17.6% |
|
Inpatient |
2.6% |
3.1% |
3.9% |
4.2% |
|
Prescriptions |
53.3% |
58.3% |
54.4% |
51.9% |
Mean Spending, If Any Medical Spending in 2013-2014
|
Expansion |
Non-Expansion |
|||
|
2013 |
2014 |
2013 |
2014 |
|
|
Office-based |
$728 |
$858 |
$762 |
$816 |
|
HOPD |
$77 |
$116 |
$224 |
$183 |
|
ER |
$153 |
$213 |
$266 |
$232 |
|
Inpatient |
$317 |
$540 |
$646 |
$525 |
|
Prescriptions |
$482 |
$1,007 |
$701 |
$747 |
Source: Authors’ analysis of 1,004 non-pregnant women ages 18-44 with incomes below 138 percent of the federal poverty level using data from the Medical Expenditure Panel Survey – Household Component Panel 18.
Notes: Only women with any total healthcare spending during 2013-2014 were included for mean spending by analyses. HOPD = hospital outpatient department. None of these outcomes were significantly associated with expansion status using difference-in-differences analyses and should be taken as suggestive only.
Table 4: Prescription Drug Utilization and Spending
|
Expansion |
Non-expansion |
|||
|
2013 |
2014 |
2013 |
2014 |
|
|
Mean Number of Prescription Fills |
6.8 |
10.2 |
7.0 |
7.2 |
|
Mean Number of Prescription Fills, Excluding Those with None |
9.8 |
14.8 |
10.6 |
10.8 |
|
Difference-in-Differences Estimates for Number of Prescription Fills |
||||
|
Expansion State |
2.78 (1.09) P = 0.012* |
|||
Source: Authors’ analysis of 1,004 non-pregnant women ages 18-44 with incomes below 138 percent of the federal poverty level using data from the Medical Expenditure Panel Survey – Household Component Panel 18.
Notes: Analysis using a difference-in-differences approach was used to compare the change in prescription drug use for women in expansion states, compared to the change for women in non-expansion states. Robust standard errors in parentheses, and 95% confidence interval in brackets. Covariates included were age, race/ethnicity, education, marital status, and health status. Pregnant women were excluded because their patterns of prescription drug use are different than non-pregnant women.
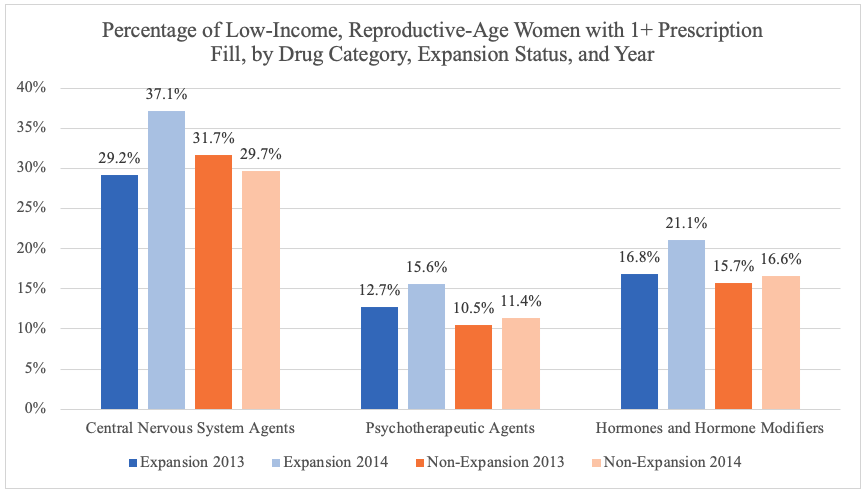
Source: Authors’ analysis of 1,004 non-pregnant women ages 18-44 with incomes below 138 percent of the federal poverty level using data from the Medical Expenditure Panel Survey – Household Component Panel 18.
Note: Pregnant women were excluded because their patterns of prescription drug use are different than non-pregnant women. These three therapeutic classes were chosen because they are the most common, accounting for the highest percentage of total prescription fills in our study. Central Nervous System Agents include pain relievers and anxiolytics and represent about 30% of total prescription fills. Psychotherapeutic Agents include antidepressants and antipsychotics and represent about 12% of total fills. Hormones and Hormone Modifiers include oral contraceptives and represent about 11% of total fills.
Appendix Exhibit 1: State Expansion Status
|
States |
|
|
Expanded before 1/1/14 |
DE, DC, MA, NY, VT |
|
Expanded on 1/1/14 |
AZ, AR, CA, CO, CT, HI, IL KY, IO, MD, MN, NM, NV, NJ, ND, OH, OR, RI, WA, WV |
|
Not expanded as of 1/1/14 |
AK, AL, FL, GA, ID, IN, KS, LA, ME, MI, MO, NC, NE, NH, OK, PA, SC, SD, TN, TX, UT, VA, WI, WY |
Source: Kaiser Family Foundation.